Echocardiographic assessment of right heart hemodynamics
Rahul Mehrotra**, Manish Bansal**, Ravi R Kasliwal,
H.K. Chopra, R.S. Sambi, Krishna C.K.
Indraprastha Apollo Hospital
Moolchand Medcity, New Delhi.
Introduction
The right atrium (RA) and ventricle (RV) are known to play an active role in maintaining normal cardiovascular function and are no longer considered to be mere conduits. Evaluation of the structure and function of the right sided heart chambers is thus an essential component of clinical management of diseases involving lungs, pulmonary vasculature and left side of the heart (1). While magnetic resonance imaging has been considered as the gold standard for structural evaluation of RV and cardiac catheterization for hemodynamics, they cannot be considered for routine assessment of patients owing to their limited availability, cost and the radiation exposure and invasive nature of cardiac catheterization.
Echocardiography is the most widely available, versatile noninvasive modality for evaluation of cardiac structure and function and is an indispensable tool in the evaluation of right heart chambers. Although the complex geometry of RV, heavily trabeculated myocardium and its retrosternal position may limit its morphological assessment by echocardiography (2), echocardiography remains an accurate modality for non-invasive quantitation of the various hemodynamic parameters of right heart– RA pressure (RAP), RV pressures (systolic, end-diastolic), pulmonary artery pressures (systolic, end-diastolic and mean), pulmonary vascular resistance (PVR) and other indices of RV function.
Accurate estimation of the various hemodynamic indices of the right side of the heart is very important for diagnosis, management, assessment of response to therapy and prognosis of various cardiopulmonary disorders (3,4). We describe here the systematic and stepwise approach to measurement of these hemodynamic parameters. Normal values of these parameters are described in table 1 (5).
RAP measurement (figure 1)
RAP can be estimated with reasonable accuracy on transthoracic echocardiography by measuring the size of the inferior vena cava (IVC) and its collapse in response to inspiration (6).
Table 1: Normal values of the commonly used parameters for assessment of right heart hemodynamics
Parameter |
Normal values |
Mean RA pressure (mmHg) |
3 (1-5) |
RV peak systolic pressure (mmHg) |
25 (15-30) |
RV end-diastolic pressure (mmHg) |
Almost same as mean RA pressure in absence of RV inflow obstruction |
PA systolic pressure (mmHg) |
Almost same as RV systolic pressure in absence of RV outflow obstruction |
Mean PA pressure (mmHg) |
15 (9-19) |
PA end-diastolic pressure (mmHg) |
9 (4-12) |
Pulmonary vascular resistance (dynes.s.cm-5) |
20-130 |
RV fractional area change (%) |
>32 |
RV myocardial performance index |
0.28±0.04 |
Tricuspid annular plane systolic excursion (mm) |
>15 |
Systolic tricuspid annular velocity (cm/s) |
>12 |
Isovolumic acceleration (m/s2) |
> 1.4±0.5 |
RV lateral wall longitudinal strain on tissue-Doppler imaging (%) |
Basal: 19±6 |
RV lateral wall longitudinal strain rate on tissue-Doppler imaging (s-1) |
Basal: 1.5±0.41 |
PA- pulmonary artery, RA- right atrium, RV- right ventricle,
correspondence: Ravi R Kasliwal, Senior Consultant Cardiology, 4262, Department of Cardiology, Indraprastha Apollo Hospital,
Sarita Vihar, New Delhi-110076. INDIA
Email: rrkasliwal@hotmail.com, Ph: +91-11-29874262, Fax: +91-11-41402511
|
 |
| Figure 1: Estimation of right atrial pressure from inferior vena cava size and collapsibility with inspiration. In the above example, estimated right pressure is 10-15 mmHg. |
Steps:
1. With the patient in left lateral decubitus position, obtain a good quality subcostal view of the IVC draining into RA.
2. Image the IVC in long-axis view.
3. With the patient breathing normally, acquire 3 separate loops covering entire respiratory cycle. Care should be taken to maximize the IVC diameter throughout the respiratory cycle.
4. Measure the size of IVC within 1-2 cm of IVC-RA junction. The measurement should be performed perpendicular to the long-axis of IVC.
5. Maximal (during expiration) and minimal (during inspiration) IVC diameters are obtained and IVC collapsibility index calculated using the formula-
IVC collapsibility index = [Maximum IVC dimension- Minimum IVC dimension] X 100/ Maximum IVC dimension
If adequate respiratory variation is not obtained during normal respiration, the patient can be asked to sniff briefly.
6. RAP is then estimated using the maximum IVC diameter and IVC collapsibility index as described in table 2.
Table 2: Echocardiographic estimation of right atrial pressure using inferior vena cava size and collapsibility with respiration
Maximum IVC diameter (mm) |
IVC collapsibility index |
Estimated mean RA pressure (mmHg) |
<17 |
> 50% |
0-5 |
>17 |
> 50% |
6-10 |
>17 |
<50% |
10-15 |
>17 |
fixed |
> 15 |
IVC- inferior vena cava, RA- right atrium
RV systolic pressure (RVSP) measurement (figure 2)
The tricuspid regurgitation (TR) jet is a reflection of the peak pressure gradient between RV and RA during systole (∆P). Simplified Bernoulli equation is used to calculate (∆P) during systole by using the peak TR velocity (v) (7). Once ∆P is calculated, RVSP can be estimated by adding RAP to ∆P.
• In apical 4-chamber view, keeping RA/RV in the centre of the sector, apply color Doppler sector on the tricuspid valve to visualize TR.
• Align a continuous wave Doppler beam through the TR jet and obtain a spectral display.
• Acquire similar displays from several views (parasternal long axis inflow view, basal short axis view or subcostal views), and use the recording with the highest velocity (v) and complete spectral envelope.
• Pressure gradient between RA and RV- (∆P) is given by the simplified Bernoulli equation as- (∆P) = 4v2.
• RVSP = ∆P+ RAP
The RA pressure is derived by the IVC method as described above.
• In the absence of RV outflow tract (RVOT) obstruction or pulmonary valve stenosis, RVSP is equal to pulmonary artery systolic pressure (PASP).
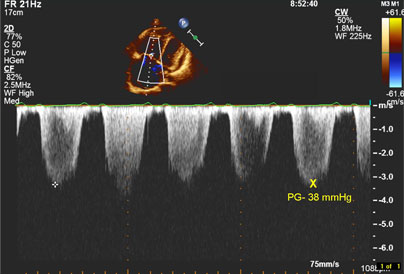 |
| Figure 2: Estimation of pulmonary artery peak systolic pressure (PASP) from peak tricuspid regurgitation gradient [see text for details]. In the above example, PASP = 38 mmHg + estimated right atrial pressure. |
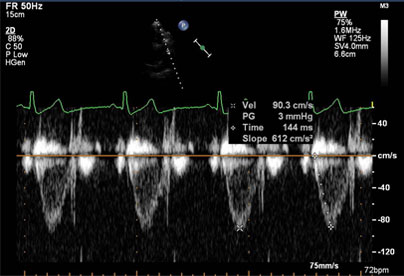 |
Figure 3: Estimation of mean pulmonary artery pressure (mPAP) from right ventricular outflow pulsed-wave Doppler examination. In the above example, acceleration time is 144 msec. Hence the estimated mPAP is 79 – 0.45 X 144 = 14 mmHg. |
In the absence of any tricuspid stenosis or RV inflow obstruction, RVEDP is likely to be equal to mean RAP and is therefore estimated from IVC as described above.
|
Mean Pulmonary artery pressure (mPAP)
There are several ways of calculating mean PA pressure by echocardiography-
A. Method 1-
mPAP= 0.61 X PASP (derived from TR velocity) + 2mm Hg.
B. Method 2-
In this method, mPAP is derived from the continuous wave spectral trace of pulmonary regurgitation (PR) jet using the simplified Bernoulli equation-
mPAP= 4 X (peak PR velocity)2.
C. Method 3 (figure 3)-
In this method, the following regression equation (also known as Mahan’s equation) is used to derive mPAP which has been shown to correlate well with invasively derived values (8)-
mPAP= 79- [0.45 X RVOT acceleration time in milliseconds)
RVOT acceleration time is measured from the pulsed-wave Doppler interrogation of the RVOT. In the basal short axis view, place the sample volume within the RVOT and obtain the velocity trace. Time from the onset of the trace to peak velocity is the acceleration time.
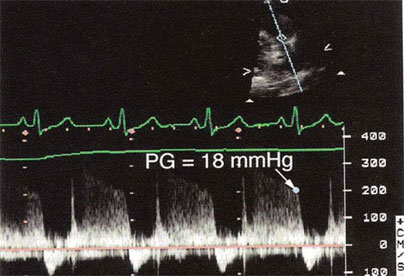 |
| Figure 4: Estimation of pulmonary artery end-diastolic pressure (PAEDP) from pulmonary regurgitation (PR) jet. Addition of right atrial pressure to PR end-diastolic gradient yields PAEDP [see text for details]. In the above example, PAEDP = 18 mmHg + estimated right atrial pressure. |
Pulmonary artery end-diastolic pressure (PAEDP) (figure 4)
PAEDP can be calculated by assessment of the PR end-diastolic velocity on Doppler interrogation of the PR jet. End-diastolic pressure gradient is derived by using simplified Bernoulli equation. Addition of the estimated RVEDP (which is similar to RAP in absence of RV inflow obstruction) to this value yields PAEDP as-
End-diastolic PR gradient= PAEDP – RVEDP
Steps:
1 Visualize the pulmonary valve in basal short axis view or parasternal long axis outflow view.
2 Apply color Doppler sector on the pulmonary valve to visualize PR jet.
3 Align a continuous wave Doppler beam through the PR jet.
4 Obtain a spectral display of the PR and measure the pressure gradient using the end diastolic PR velocity.
5 Add estimated RVEDP (which is equal to RAP) to the pressure gradient to get PAEDP.
Pulmonary vascular resistance (PVR)
PVR is an important hemodynamic variable and is extremely useful in pulmonary hypertension (PH). Calculation of PVR helps in assessment of the etiology of PH (hyperdynamic versus obstructive PH), response to therapy and prognosis.
Although cardiac catheterization is the most accurate method for measurement of PVR, Doppler echocardiography can help in providing an estimate of PVR non-invasively. On echocardiography, PVR can be calculated using the following regression equation-
PVR (Wood units) = [Peak TR velocity (m/s) / RVOT velocity time integral (cm)] X 10 + 0.16.
To convert Wood units to metric units (dynes.s.cm-5), the result needs to be multiplied with 80.
Steps:
1 Obtain peak TR velocity as described previously.
2 Obtain RVOT pulsed-wave Doppler recording and trace the entire spectral display to obtain velocity time integral.
3 Use the above-mentioned equation to calculate PVR. It has been shown that PVR derived by this method is accurate and correlates well with the cardiac catheterization derived values (9).
Assessment of RV Contractility
Unlike the left ventricle, estimation of RV ejection fraction by either modified Simpson method or by area length method has only moderate correlation with MRI derived RV ejection fraction. However, several other indices of contractility have been evaluated and found useful in evaluating RV contractile function.
|
Myocardial performance index (MPI)
Proposed by Tei et al in 1996 (10), it is a non-geometric index of global ventricular function, is relatively load-independent and can be used for the right as well as the left ventricle. The myocardial performance index or “Tei index” as it is called is derived from three time intervals- isovolumic contraction time (IVCT), isovolumic relaxation time (IVRT) and ejection time (ET), using the following formula (figure 5)-
MPI = (IVRT+IVCT)/ET
 |
| Figure 5: Schematic diagram showing measurement of myocardial performance index. A-atrial filling velocity; E -rapid filling velocity; ET- ejection time; IVCT- isovolumic contraction time; and IVRT- isovolumic relaxation time. |
In case of the left ventricle, all the three time intervals can be recorded from a single view by placing pulsed-Doppler sample volume in left ventricular outflow tract. However, for RV “Tei index”, a different approach has to be used-
1 Obtain a good quality 4-chamber view from the apical window keeping the tricuspid valve in the centre of the image.
2 Place the pulsed-wave sample volume at the level of the tips of the tricuspid valve leaflets.
3Acquire at least three consecutive beats of tricuspid inflow waveforms.
4 Measure the time interval (T) from the end of the inflow waveform (end of “a” wave) to the onset of next inflow waveform (onset of next E wave).
5Next, measure the RVOT ejection time (ET) from the pulsed-wave Doppler at the RVOT in basal short axis view. It is essential to ensure that the heart rate remains same during both the measurements.
6 Divide (T-ET) by ET to derive “Tei index” (figure 6).
“Tei index” is a very sensitive and specific indicator of PH and has been shown to be a powerful prognostic marker (11).
 |
| Figure 6: Estimation of right ventricular myocardial performance index (MPI) or Tei index using pulsed-wave Doppler with sample volume placed near tricuspid leaflet tips (6a) and right ventricular outflow tract (6b). In the above example, MPI is (405-333)/333 = 0.22 (see text for details). |
Tricuspid annular plane systolic excursion (TAPSE) (figure 7)
TAPSE represents the systolic excursion of the lateral tricuspid annulus and has been shown to be a relatively load-independent marker of RV systolic performance. It is measured using the M-mode.
Steps:
1) In apical 4-chamber view, align the M-mode beam so that it passes through the lateral tricuspid annulus
2) Obtain the M-mode trace showing longitudinal excursion of the annulus.
3) Measure the systolic excursion using measuring calipers. This represents TAPSE.
This index has correlated well with radionuclide angiography derived RV ejection fraction (12).
 |
Figure 7: Measurement of tricuspid annular plane systolic excursion by m-mode at lateral tricuspid valve annulus. |
|
The use of tissue-Doppler imaging at high frame rates has been applied to tricuspid annulus as a useful measure of RV contractility although it is influenced by preload and afterload.
1) Obtain a good apical 4-chamber view.
2) Activate tissue-Doppler imaging. Align the ultrasound beam with the lateral tricuspid annulus.
3) Place the pulsed-wave sample volume within the lateral tricuspid annular tissue to get a trace of the myocardial velocities during different phases of the cardiac cycle.
4) The peak velocity during systole is measured and recorded.
|
| Figure 8: Measurement of tricuspid annular systolic velocity by tissue-Doppler imaging. |
Isovolumic acceleration (IVA) (figure 9)
IVA is a promising new index of RV contractile performance and has been studied in patients with congenital heart disease (13). The major advantage of IVA is that it is relatively load-independent. IVA is derived using tissue-Doppler imaging.
Steps:
1) Follow the steps mentioned above to get the tissue-Doppler trace of lateral tricuspid annulus.
2) Measure the peak isovolumic contraction velocity and the time-to-peak isovolumic contraction velocity.
3) IVA is calculated as-
IVA (m/s2)= Peak velocity (m/s) ÷ time to peak velocity(sec)
Strain and strain rate imaging
Strain and strain rate are measures of myocardial deformation and, unlike tissue-Doppler derived myocardial velocities, offer advantage of being immune to the effects of tethering and translation movements of the heart. For this reason, both strain and strain rate are being increasingly used as markers of myocardial contractility in various disease states. While strain is influenced by load, strain rate is relatively load-independent.
There are two different approaches for measurement of strain and strain rate- tissue-Doppler based and the more recently speckle-tracking based approach. The major advantage of speckle-tracking based strain imaging is that it is not dependent on angle of insonation which is the major problem with tissue-Doppler imaging. However, speckle tracking is highly dependent on gray-scale image quality for optimum accuracy.
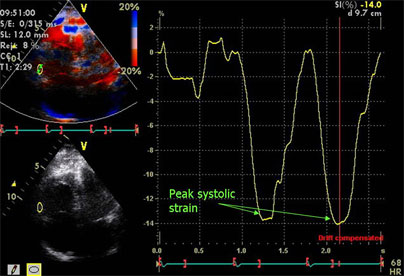
At present, only limited data is available regarding role of strain imaging in assessment of RV contractile function. For clinical purpose, longitudinal strain and strain rate at RV lateral wall can be measured from the apical 4-chamber view using either of the two approaches (figure 10). A detailed description of measurement of RV strain and strain rate is beyond the scope of the present discussion.
 |
Figure 9: Measurement of right ventricular isovolumic acceleration by tissue-Doppler imaging with sample volume at lateral tricuspid annulus. In the above example, isovolumic acceleration is 0.073/0.032 = 2.3 m/s2. |
 |
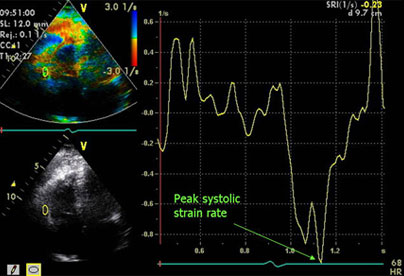 |
| Figure 10: Measurement of longitudinal strain (10a) and strain rate (10b) at basal right ventricular free wall using tissue Doppler imaging. |
Assessment of RV diastolic function
Unlike the left ventricle, assessment of RV diastolic function is not well characterized. Measurement of RV stiffness, for example, has not been possible owing to difficulty in measuring RV volume simultaneously. Besides, RV diastole is composed of many phases and no single parameters can be used to define it.
|
Hepatic vein systolic flow reversal is seen only in severe diastolic dysfunction and is not a specific marker for diastolic dysfunction since severe TR may also give rise to S/D ratio <1.
Points to remember:
1. For all measurements, ensure a good quality ECG with a stable baseline and choose en ectopic free sequence and acquire at least 3-5 beats.
2. While obtaining TR and PR traces using continuous wave Doppler, align the incident beam as parallel to the color jet as possible (<20 degrees ) and ensure that the beam passes through the origin of the jet.
3. While analyzing TR jet, select the jet with maximum velocity from all views. Measurement of RVSP from incomplete TR jets should preferably be avoided. If the spectral-display of TR jet is faint or incomplete, injection of agitated saline can be used to make it prominent.
4. RVSP is underestimated in presence of severe TR and may not be very accurate.
5. IVC collapsibility can not be used for estimating mean RAP in patients on mechanical ventilation.
6. For TDI based indices like IVA, a sweep speed of 50-100 is recommended as it improves temporal resolution.
7. It is advisable to obtain all measurements in triplicate and then average them to ensure reproducibility.
References:
1. Nagel E, Stuber M, Hess OM. Importance of the right ventricle in valvular heart disease. Eur Heart J 1996;17:829-36.
2. Ho SY, Nihoyannopoulos P. Anatomy, echocardiography, and normal right ventricular dimensions. Heart 2006;92 Suppl 1:i2-13.
3. Burgess MI, Mogulkoc N, Bright-Thomas RJ, Bishop P, Egan JJ, Ray SG. Comparison of echocardiographic markers of right ventricular function in determining prognosis in chronic pulmonary disease. J Am Soc Echocardiogr 2002;15:633-9.
4. de Groote P, Millaire A, Foucher-Hossein C, et al. Right ventricular ejection fraction is an independent predictor of survival in patients with moderate heart failure. J Am Coll Cardiol 1998;32:948-54.
5. Haddad F, Hunt SA, Rosenthal DN, Murphy DJ. Right ventricular function in cardiovascular disease, part I: Anatomy, physiology, aging, and functional assessment of the right ventricle. Circulation 2008;117:1436-48.
6. Lang RM, Bierig M, Devereux RB, et al. Recommendations for chamber quantification: a report from the American Society of Echocardiography's Guidelines and Standards Committee and the Chamber Quantification Writing Group, developed in conjunction with the European Association of Echocardiography, a branch of the European Society of Cardiology. J Am Soc Echocardiogr 2005;18:1440-63.
7. Yock PG, Popp RL. Noninvasive estimation of right ventricular systolic pressure by Doppler ultrasound in patients with tricuspid regurgitation. Circulation 1984;70:657-62.
8. Chan KL, Currie PJ, Seward JB, Hagler DJ, Mair DD, Tajik AJ. Comparison of three Doppler ultrasound methods in the prediction of pulmonary artery pressure. J Am Coll Cardiol 1987;9:549-54.
9. Abbas AE, Fortuin FD, Schiller NB, Appleton CP, Moreno CA, Lester SJ. A simple method for noninvasive estimation of pulmonary vascular resistance. J Am Coll Cardiol 2003;41:1021-7.
10. Tei C, Dujardin KS, Hodge DO, et al. Doppler echocardiographic index for assessment of global right ventricular function. J Am Soc Echocardiogr 1996;9:838-47.
11. Yeo TC, Dujardin KS, Tei C, Mahoney DW, McGoon MD, Seward JB. Value of a Doppler-derived index combining systolic and diastolic time intervals in predicting outcome in primary pulmonary hypertension. Am J Cardiol 1998;81:1157-61.
12. Ueti OM, Camargo EE, Ueti Ade A, de Lima-Filho EC, Nogueira EA. Assessment of right ventricular function with Doppler echocardiographic indices derived from tricuspid annular motion: comparison with radionuclide angiography. Heart 2002;88:244-8.
13. Vogel M, Derrick G, White PA, et al. Systemic ventricular function in patients with transposition of the great arteries after atrial repair: a tissue Doppler and conductance catheter study. J Am Coll Cardiol 2004;43:100-6.
14. Abbas A, Lester S, Moreno FC, Srivathsan K, Fortuin D, Appleton C. Noninvasive assessment of right atrial pressure using Doppler tissue imaging. J Am Soc Echocardiogr 2004;17:1155-60.
|